Tackling energy use is one of the most financially beneficial things that an organisation can do.
For companies and operations that have not addressed this before, savings can be as high at 50-60% against total energy and fuel spend.
It is important to first establish a baseline; Total energy use in kWh by each fuel type.
This can also be converted into actual cost to give a clearer understanding of where the major costs to the company reside.
For example, in a recent site assessment of a large UK-wide company with energy costs of just over £6m, the breakdown was as follows:
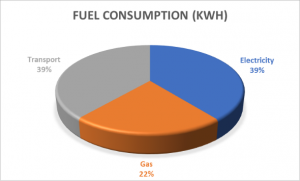
The share out in this “Fuel Consumption” first graph (in kWh suggests) that this £6m might be split roughly:
Electricity £2.5m (39%)
Transport Fuel (Derv) £2.5m (39%)
Gas £1m (22%)
Energy consumption for gas (in kWh) might initially look reasonably high. However, ‘note the orange‘. As can be seen in the second “Fuel Cost ” graph, when looked at by cost (because gas prices are so much lower when compared with electricity and diesel fuel), it was less of an issue and might therefore be less of an early target for seeking and targeting energy savings.
In fact, after factoring the cost per unit (kWh) for each of these three fuels, the reality of this £6m split looked more like this:
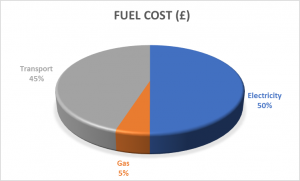
Electricity £3m (50%)
Transport Fuel (Derv) £2.7m (45%)
Gas £290,000 (5%)
Once 12 months of energy data has been established and calculated, it should be normalised so that it can be compared against previous and future years without the effects of variable such as unseasonably cold or mild winters, changes to operation or shift patterns or other aspects that don’t allow for fair comparisons to be made.
Once a baseline has been set (See SECR requirements on large companies), it can be used to work from and to set targets from, as well as considering what intensity ratios to use (examples might be tonnes of GHG by £ millions of income or per tonne of production for which we can establish what works best for your organisation and conduct regression analysis to establish this). By implementing energy saving measures, technologies and controls, and then measuring and monitoring these going forward, the kWh figure (used as the baseline) should start to reduce and can be tracked against our production index.
Whilst the graphical example above relates to costs, it is important in assessing energy and fuel data to use actual, and comparable consumption data such a litres and kWh for all such calculations. This is because the cost of energy and fuel will rise (and occasionally – albeit rarely, fall) over time based on global trends, inflation, VAT rates and government taxes. We have no control over any of these and they have little to no effect on your energy consumption. (Albeit if the cost of energy or fuel skyrocketed, we might all be more inclined to use it more sparingly).
However, if carrying out baseline and ongoing calculations in sterling (£), it might be easy to believe a saving has been made during a year when in reality, the price of the gas that you had procured had simply been low at the time you bought it. This is the essence of normalisation.
Contact us to see how we can get a better handle on your data and bring your costs down through assessment, accurate monitoring, technologies, measures and controls.
Or call Alan Asbury on 07954 702792